important links
about the project
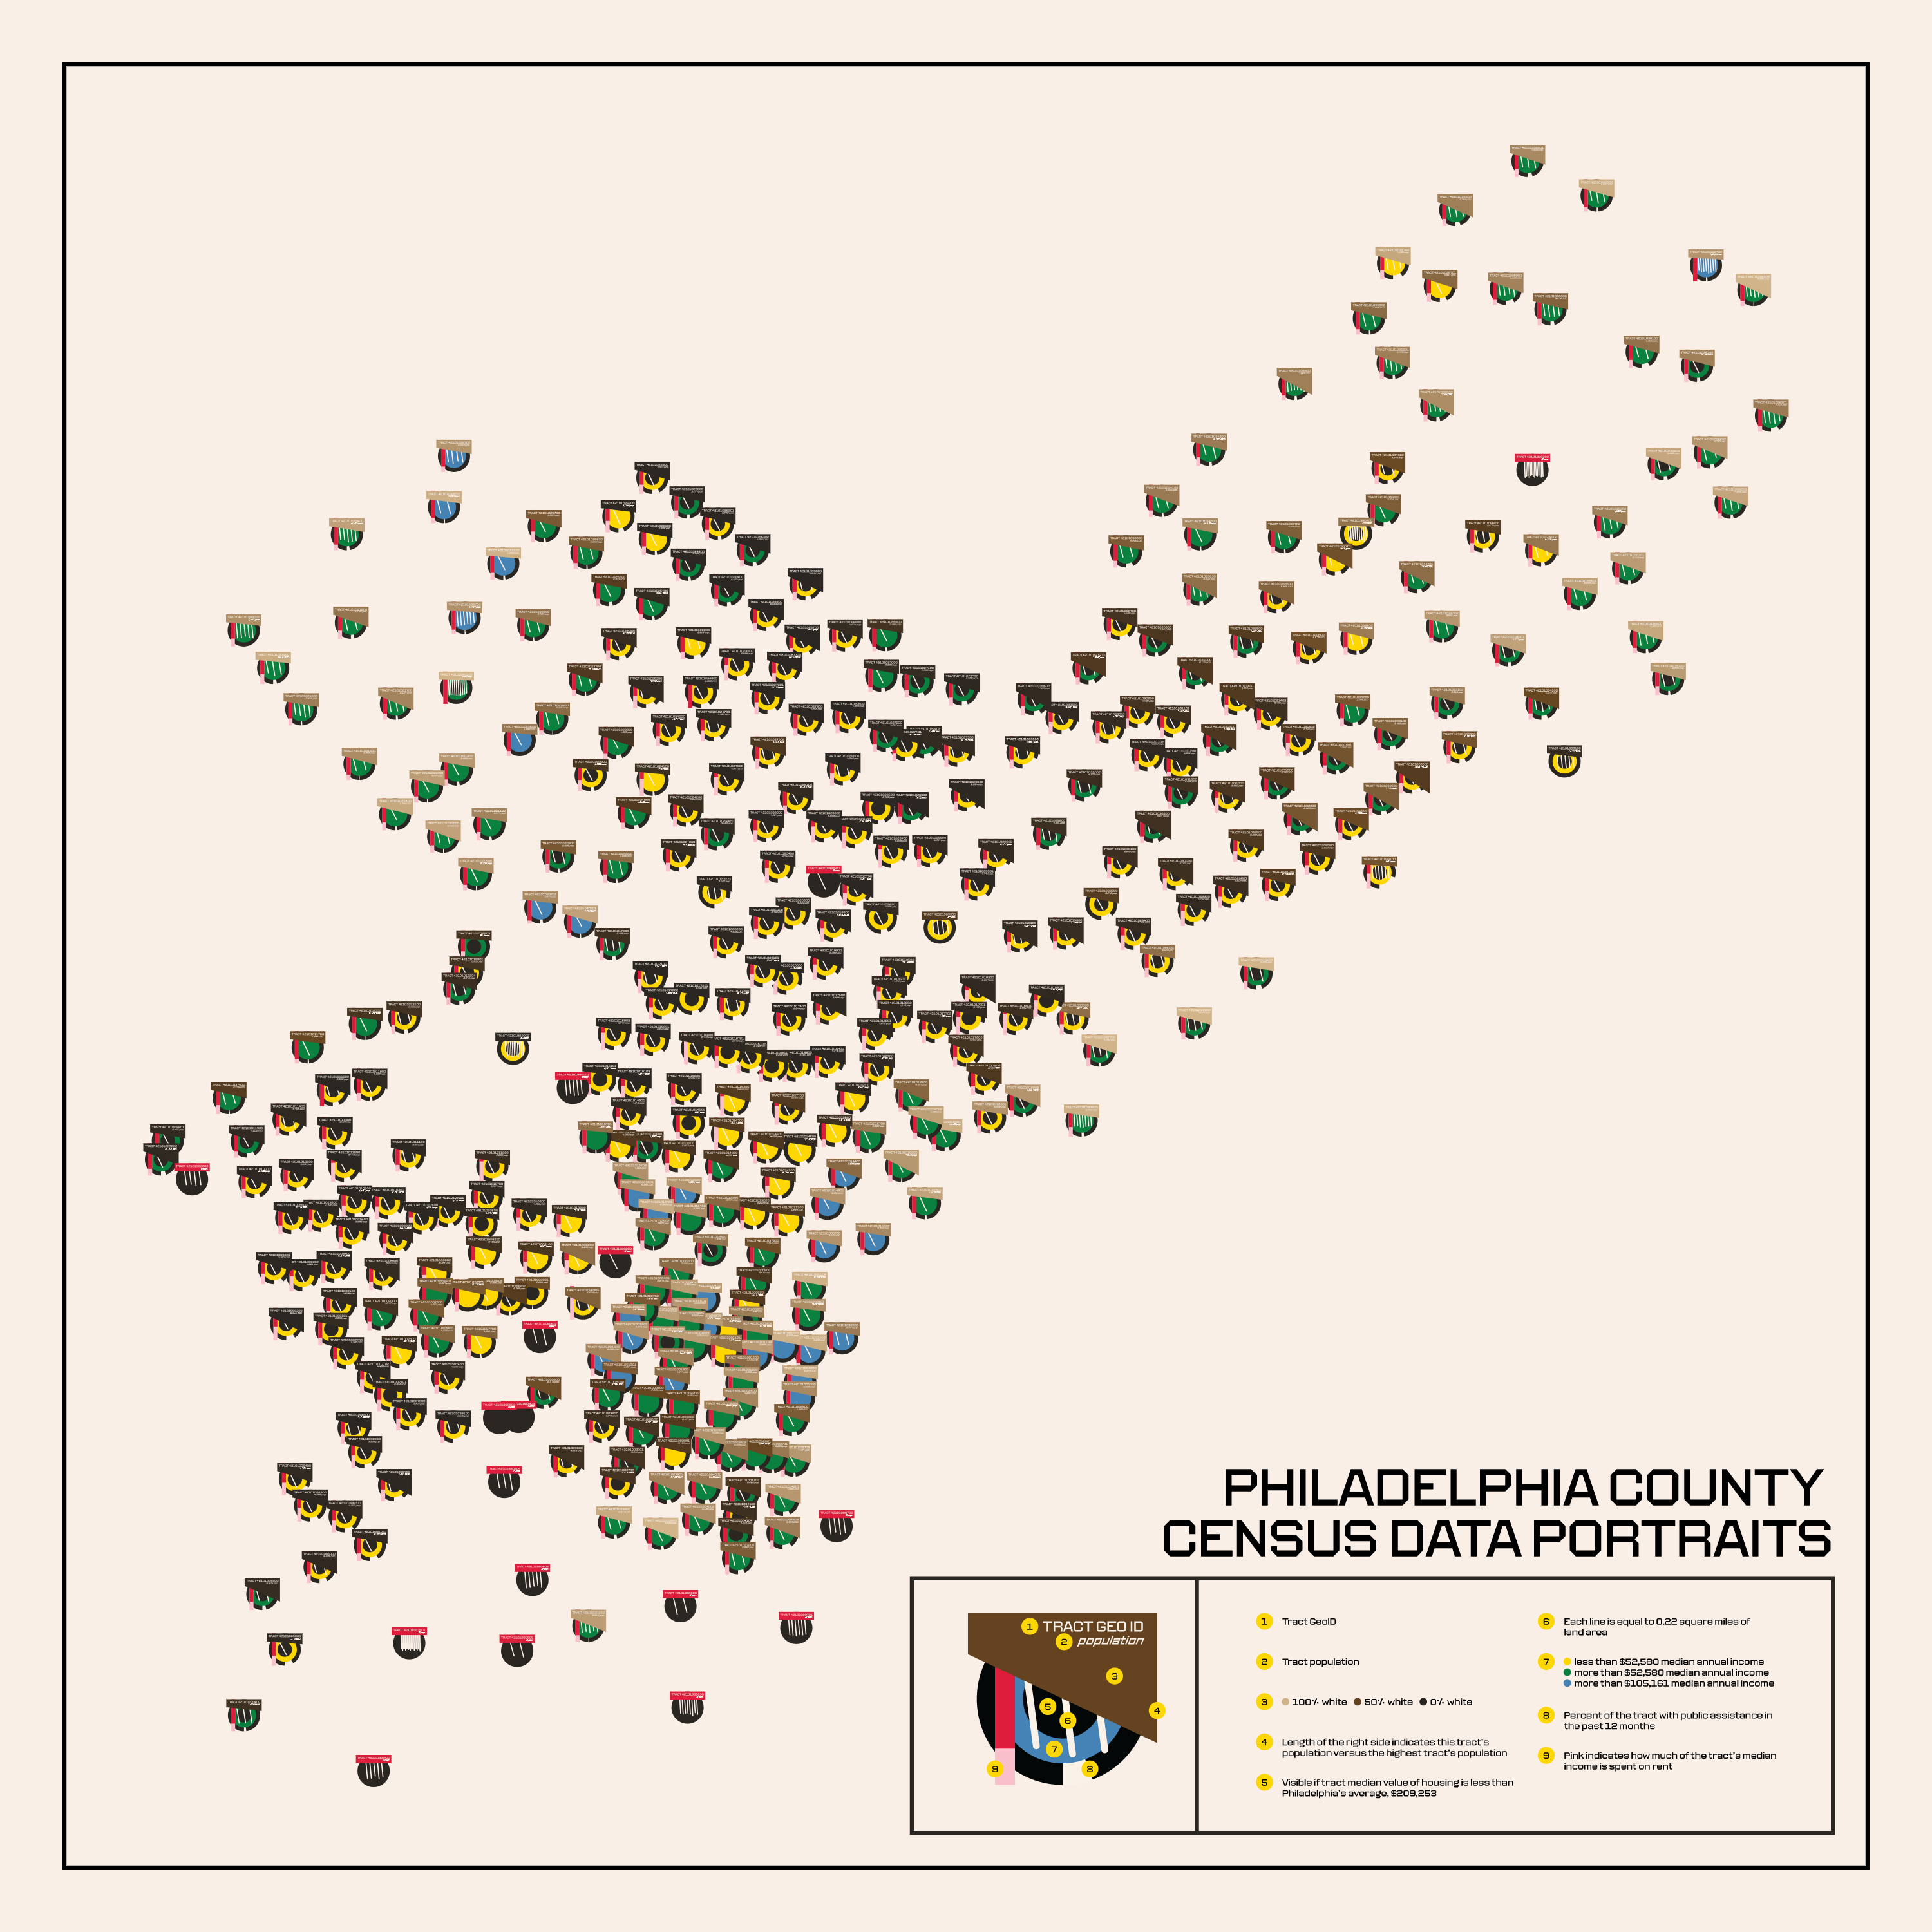
For our final project, we were tasked with using the JavaScript library, p5.js, to parse Census, American Community Survey, and Census Gazetteer data to create an interactive visualization of a county’s Census tracts. I created a visualization of Philadelphia County’s tracts, inspired by the work of WEB DuBois and Giorgia Lupi.